New in CaptainDNS: central history and continuous DNS monitoring
By CaptainDNS
Published on November 7, 2025
TL;DR - Diagnose, archive, share, then monitor: CaptainDNS now brings the entire lifecycle of a DNS query into a single interface. Every action you launch (simple lookup, propagation test, email tool, ...) is recorded and can be turned into continuous monitoring with one click--no scripts, no cron.
1) Full logging of CaptainDNS requests
What changes for you
As soon as you launch an action in CaptainDNS, it is logged automatically and available in your Profile:
- Up to 50 recent actions, grouped by tool type.
- For each entry: time, status, duration, source (public UI, signed-in session, automation).
- A share link when available, so you can pass the result to a teammate or support.
- A "Start monitoring" button to turn a one-off query into continuous tracking without re-entering the form.
Why it matters
- Instant collaboration: share a public link that replays the exact context of the lookup.
- Faster support: the history keeps the request identifier; support can find it, replay it, and understand faster.
- Traceability: you always know what was done, from where, when, and how long it took.
Key point
One place--your Profile--now gathers every CaptainDNS action, ready to filter, share, and (now) monitor.
2) Continuous monitoring of DNS resolutions
One-click creation
From the history, click "Start monitoring":
- CaptainDNS checks whether an active watch already exists for the name/type pair (to avoid duplicates).
- Creation is confirmed, then the history and the active watch list refresh automatically.
Consolidated watch view
In Profile -> DNS Monitoring, each watch shows:
- Watched name and record type.
- Creation date and last observation.
- Quick actions: open the detailed sheet or stop the watch.
The view stays available even without a recent observation.
Platform automation
Once created, the watch is re-run automatically by the CaptainDNS worker (every 15 minutes by default).
Each run replays the original query, compares the new response with the previous ones, and flags:
- Content changes,
- Latency anomalies.
All of that without opening the tool again.
Detailed observation analysis
The detailed sheet of a watch lists every execution:
- "Change" or "latency anomaly" badges.
- Observed TTL range.
- Direct link to the shared snapshot.
- Normalized DNS responses with a comparison panel.
- JSON diffs so you can see exactly what was added, removed, or modified on a given date.
Alerting and context
Each observation keeps a link to the original request (and its share token when available). One click reopens the history so you can inspect the full result or share the event.
Key benefits
-
Capitalize on centralized history
All your CaptainDNS "engine" actions are grouped in one place, filtered by tool, with instant share links. Ideal for collaboration and internal support. -
React faster to DNS changes
Monitoring turns a one-off query into a permanent safety net. Catch incomplete propagation, unexpected SERVFAIL, or abnormal latency before users notice. -
Autonomy and transparency
You stay in control of your watches (create, view, delete) and get detailed sheets that are clear with just enough context to understand what changed.
How to get started
- Launch a lookup, propagation test, or email tool.
- Open your Profile
Find the request inside your 50 latest actions (filter by tool).
- Click "Start monitoring" to create the watch.
- Visit the DNS Monitoring section
See the watch row, open the detailed sheet, or stop it when needed.
Real-world scenarios
- Go-live: you publish a new record. Monitoring detects incomplete propagation and highlights it with a "change" badge.
- Incident: a SERVFAIL appears overnight. In the morning you have the full history and JSON diff to understand what diverged.
- Performance: you suspect abnormal latency on an MX. Observations surface it over time, without manual checks.
FAQ
How many actions are kept in the history?
Your last 50 actions, with time, status, duration, source, and share link (when available).
How often does monitoring run?
By default every 15 minutes, through the CaptainDNS worker.
How do you avoid duplicates?
When creating a watch, CaptainDNS checks whether an active watch already exists for the name/type pair.
Can I share a result?
Yes. History entries and observations keep the identifier and, if requested, a public link ready to share so others can replay the context.
Takeaway
Combining centralized history with continuous monitoring, CaptainDNS delivers a complete journey: diagnose, archive, share, then monitor--without switching tools.
Related MCP and CaptainDNS guides
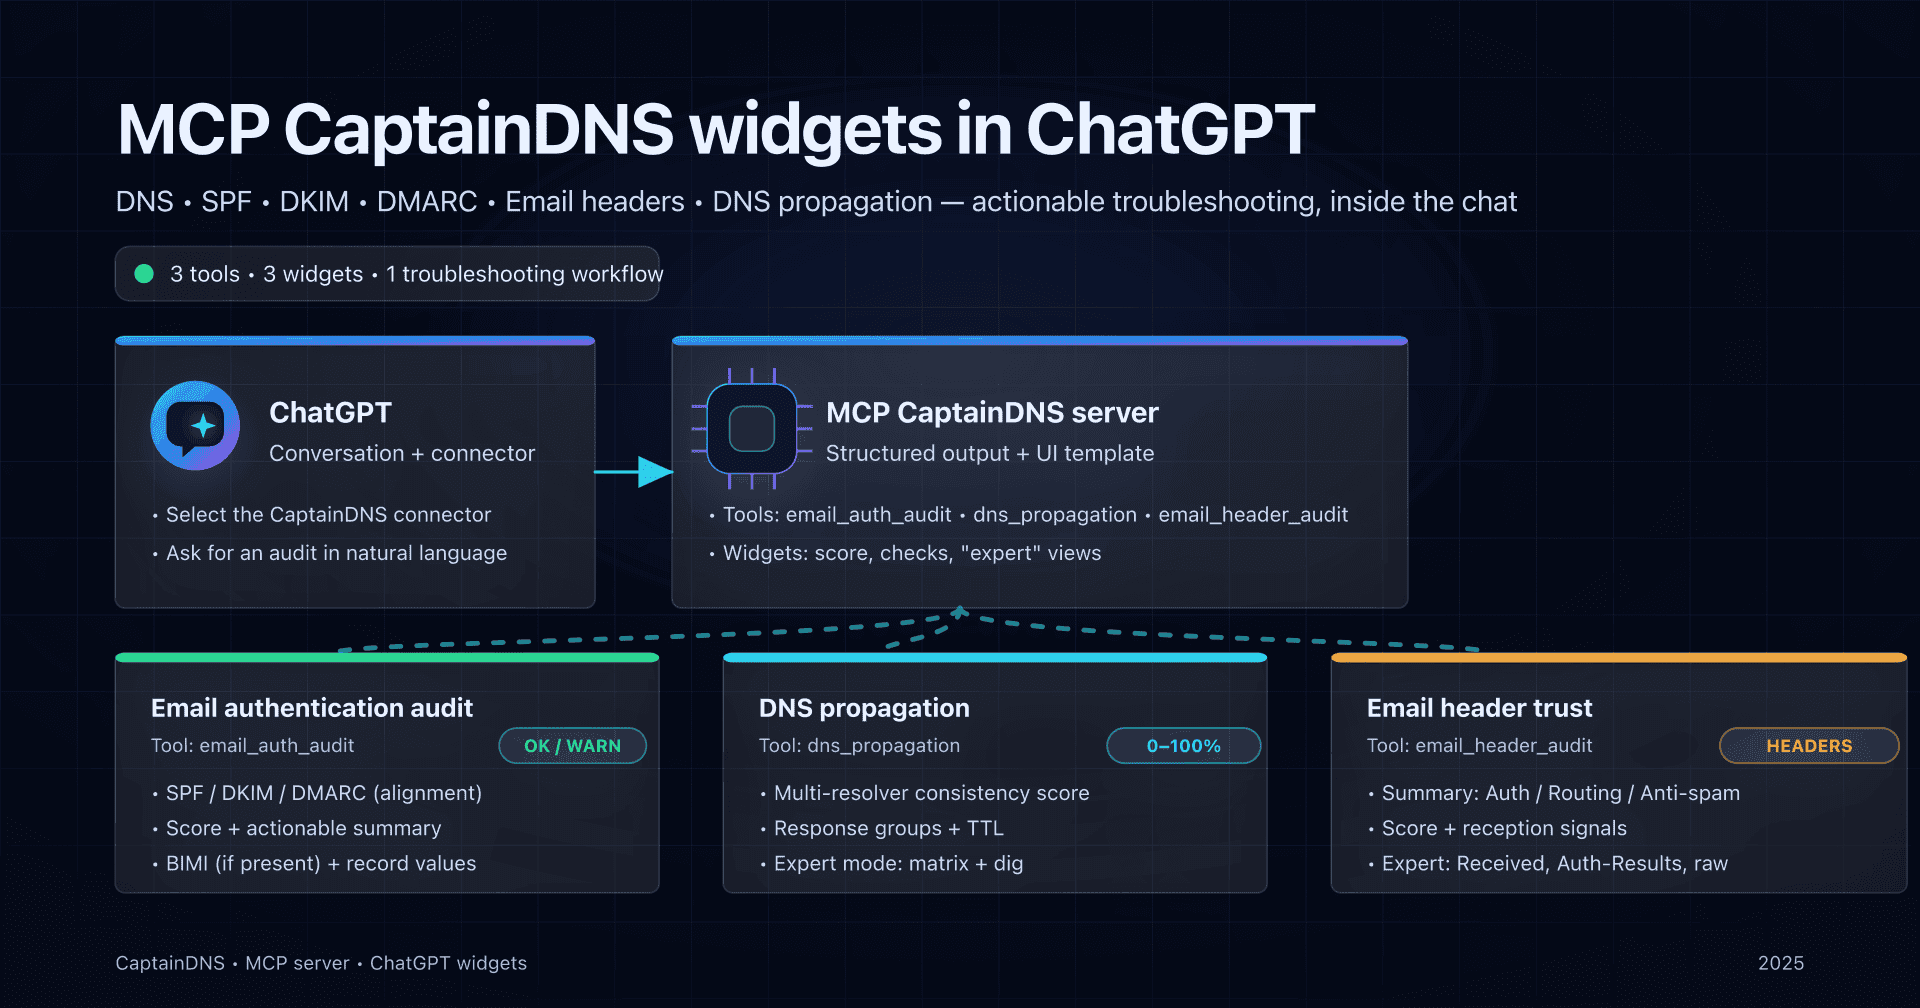
- Introduction to MCP for CaptainDNS - Learn what MCP is and why CaptainDNS adopts it.
- CaptainDNS MCP Architecture - Dive into the technical details of the MCP server.
- Auth0 + MCP Integration - OAuth2 authentication for the CaptainDNS MCP.
- MCP Widgets for ChatGPT - How ChatGPT widgets leverage the CaptainDNS MCP.
- Email Audit Widget in ChatGPT - Implementation of the email_auth_audit widget.
- Resilient DNS Monitoring - Building multi-layer DNS surveillance.