Median web page weight in 2025: 15 years of web bloat
By CaptainDNS
Published on February 12, 2026
- In 2025, the median web page weighs 2.6 MB on desktop and 2.3 MB on mobile - a 5x increase in 15 years.
- Images still account for ~40% of total weight, but JavaScript has surpassed images in number of requests (24 JS files vs. 18 images per page).
- A mobile page in 2025 weighs as much as a desktop page in 2022: mobile "follows" desktop with a 2-year lag.
- Test your pages with our Page Crawl Checker to check whether they exceed Googlebot's 2 MB threshold.
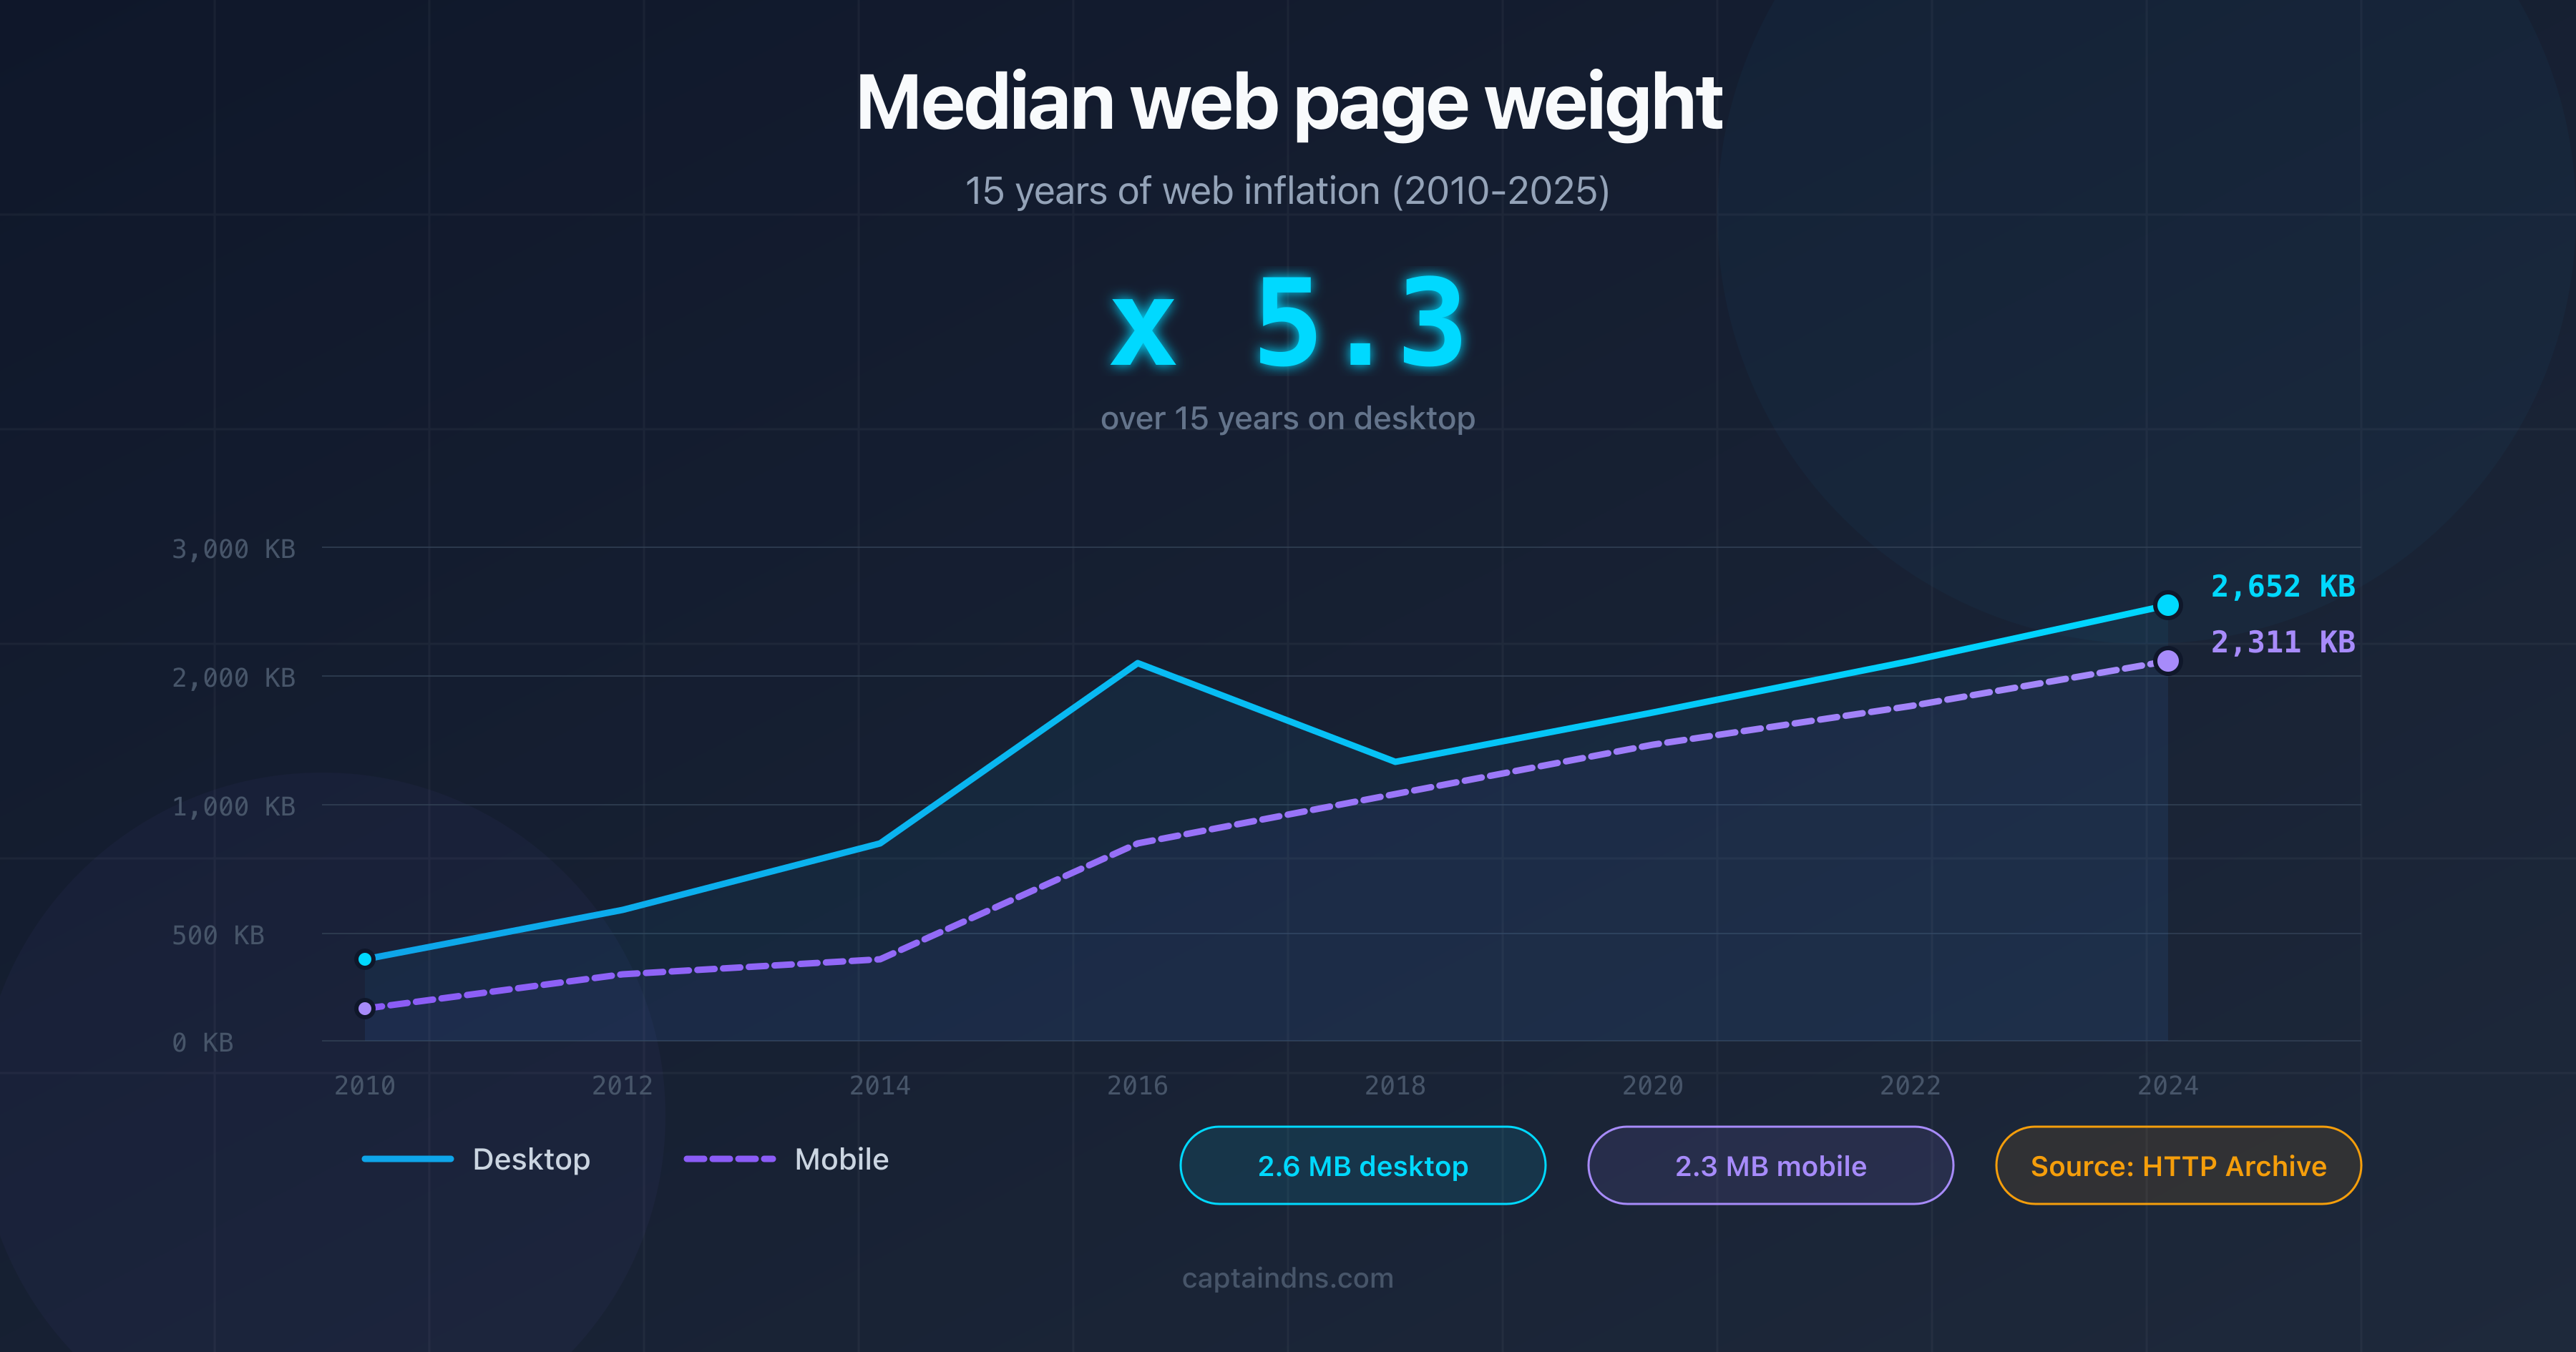
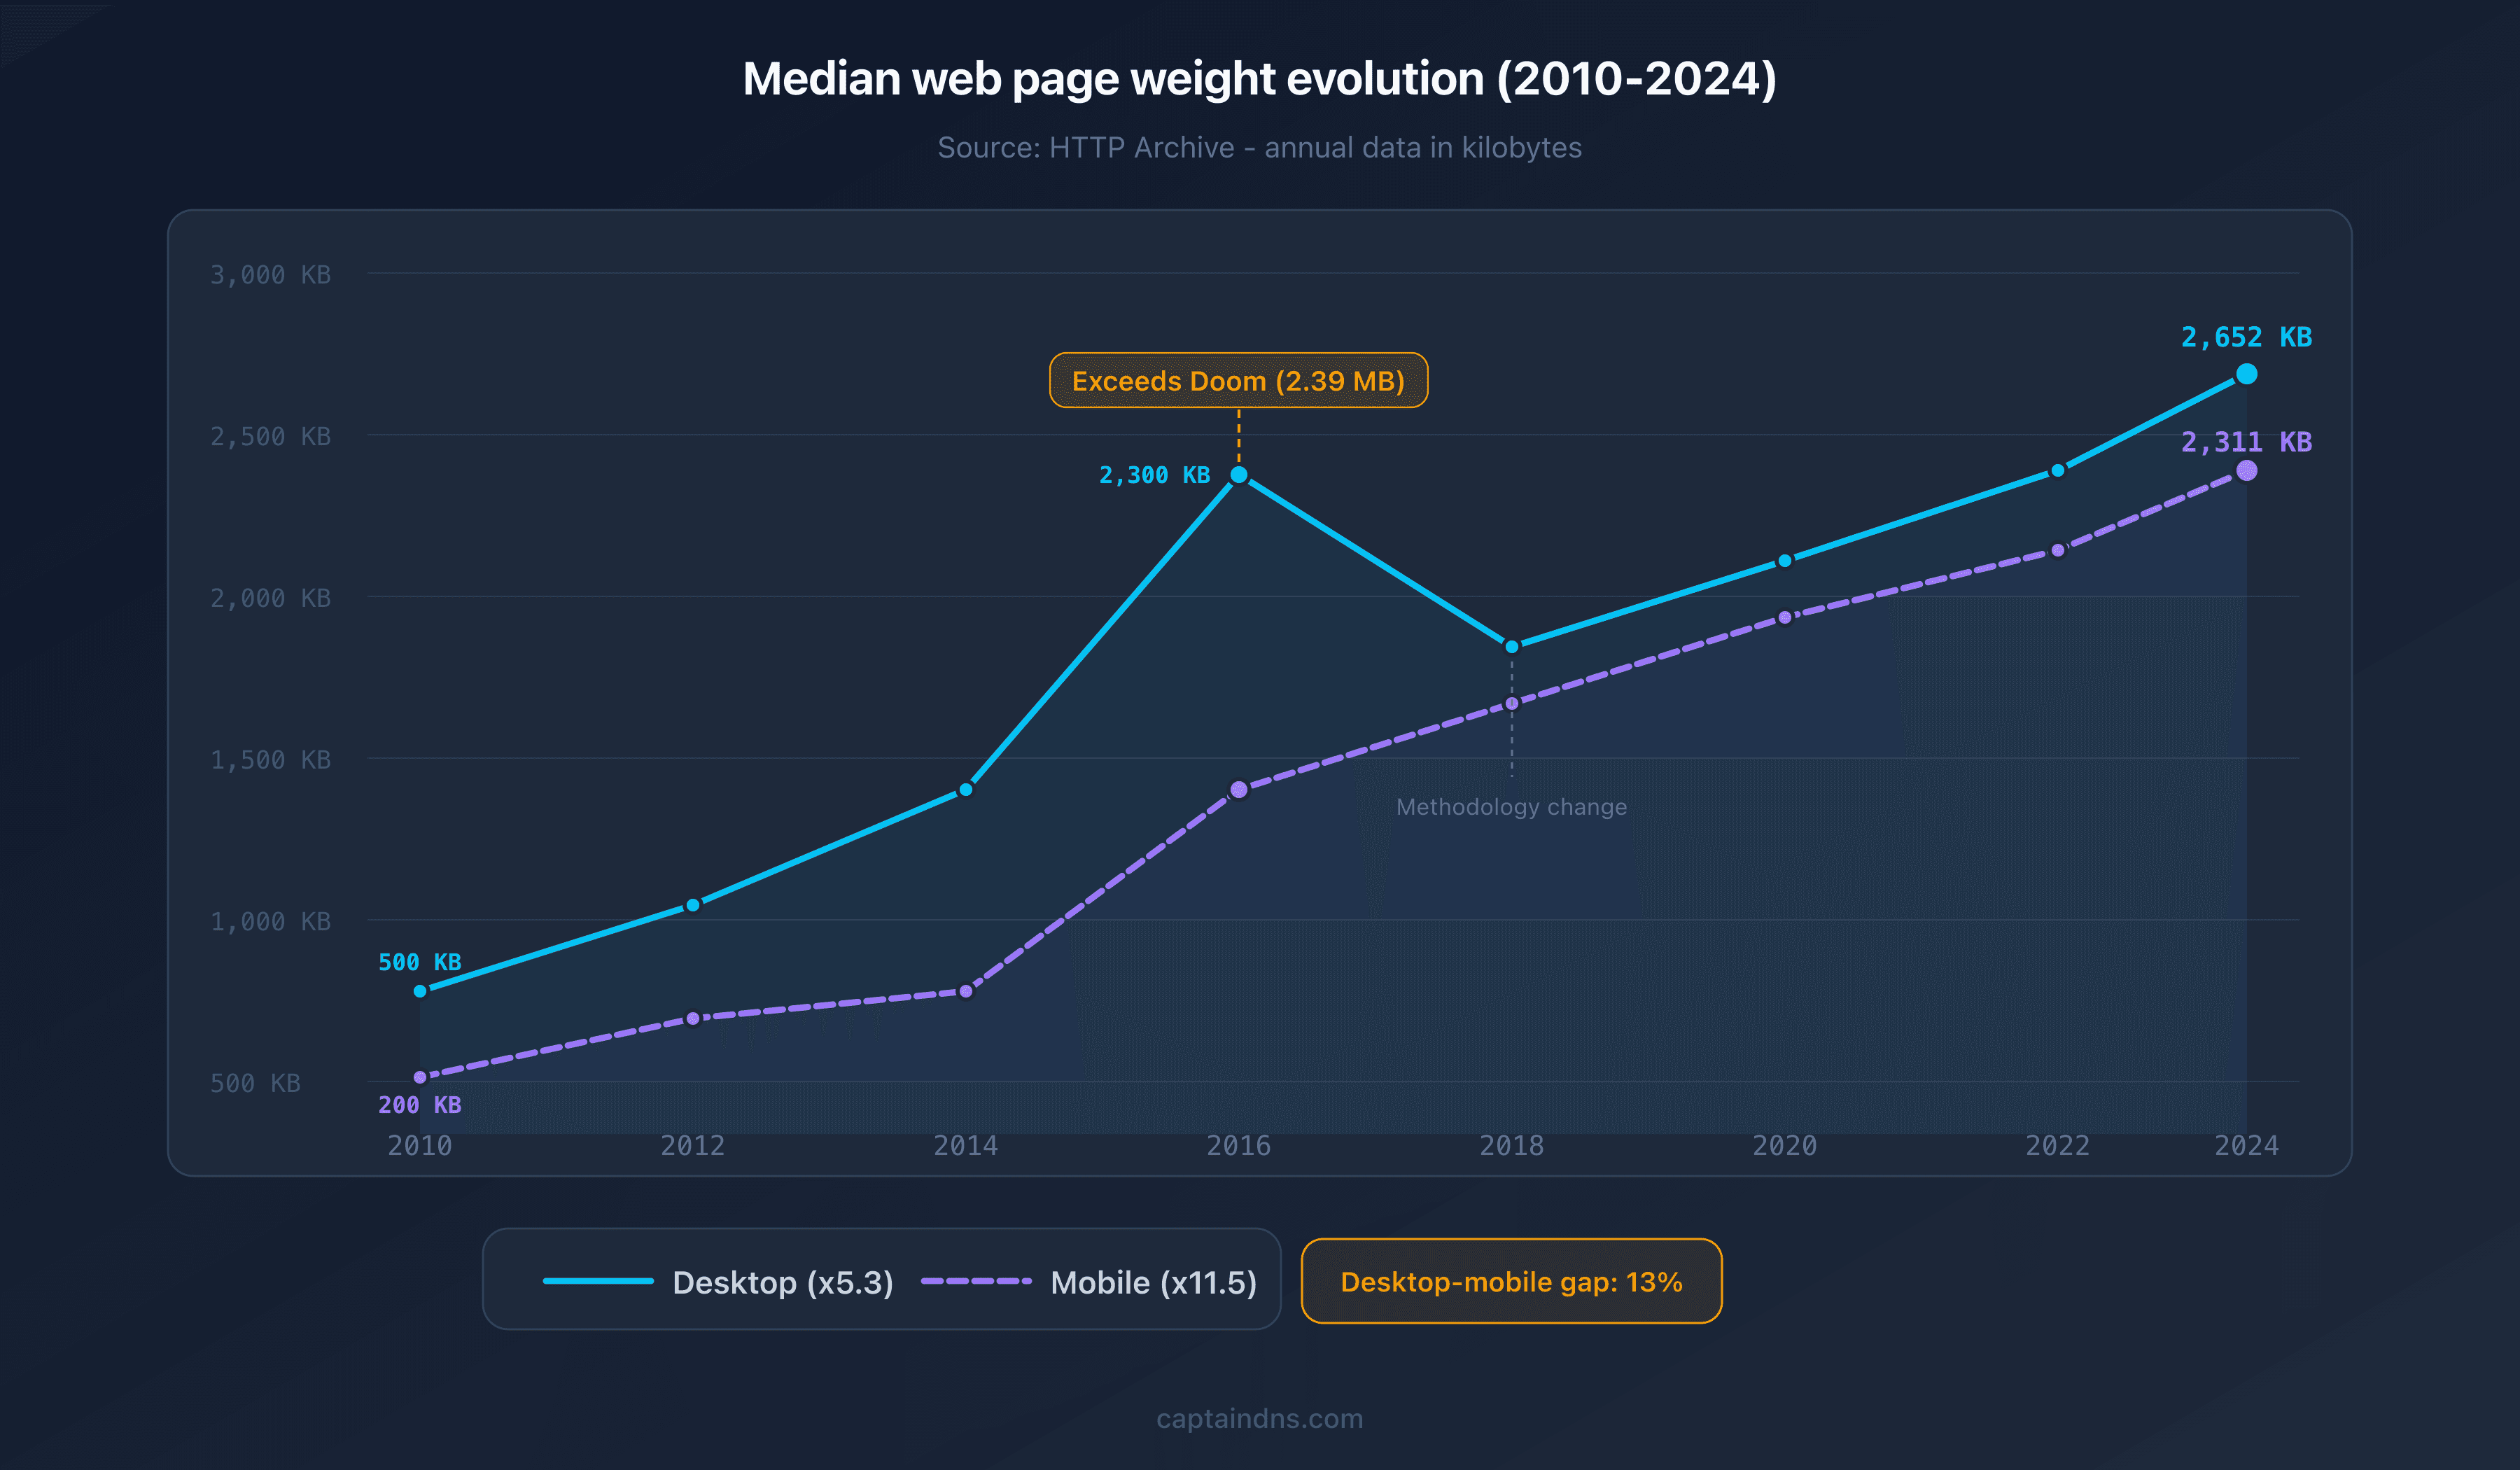
In 2025, the median web page weighs more than the original Doom game (2.39 MB in 1993). That's not a joke: according to HTTP Archive data, the median desktop page weight reached 2 652 KB by late 2024, or 2.6 MB. Over 15 years, the web has put on weight. A lot of weight.
This bloat isn't trivial. Page weight directly affects load time, Core Web Vitals, Google's crawl budget, and even your site's carbon footprint. For sites with more than 10,000 pages, every extra kilobyte multiplies into bandwidth consumed, CPU time spent, and crawl budget wasted.
This article traces 15 years of web page weight evolution (2010-2025), analyzes what makes pages heavy today, measures the impact on performance and SEO, and provides projections for the future. All data comes from HTTP Archive and the Web Almanac.
The evolution of web page weight (2010-2025)
Key milestones of web bloat
HTTP Archive has been tracking page weight since 2010. Here are the major milestones:
| Year | Median desktop | Median mobile | Notable event |
|---|---|---|---|
| 2010 | ~500 KB | ~200 KB | HTTP Archive begins tracking |
| 2012 | ~800 KB | ~400 KB | Responsive design goes mainstream |
| 2014 | ~1 200 KB | ~500 KB | First headlines: "the average page exceeds 2 MB" |
| 2016 | ~2 300 KB | ~1 200 KB | The median page surpasses the Doom installer (2.39 MB) |
| 2018 | ~1 700 KB | ~1 500 KB | HTTP Archive methodology change |
| 2020 | ~2 000 KB | ~1 800 KB | COVID accelerates digitization |
| 2022 | ~2 312 KB | ~2 037 KB | JS frameworks dominate, Google pushes Core Web Vitals |
| 2024 | ~2 652 KB | ~2 311 KB | JavaScript surpasses images in number of requests |
In 14 years, the median desktop weight has grown by a factor of 5.3x. On mobile, growth is even more dramatic: 11.5x.
Desktop vs. mobile: a gradual convergence
The gap between desktop and mobile narrows every year. In 2010, a mobile page weighed 2.5x less than a desktop page. By 2024, the gap is only 13% (2 652 KB vs. 2 311 KB).
A revealing finding: the 2024 mobile weight (2 311 KB) is virtually identical to the 2022 desktop weight (2 312 KB). Mobile follows desktop with roughly a 2-year lag. Mobile-specific optimizations (responsive images, lazy loading) no longer offset the overall growth in resources.
Technological tipping points
Three periods accelerated the bloat:
2012-2015: responsive design. The widespread adoption of fluid grids and media queries encouraged loading the same resources on all devices. Retina images (2x, 3x) doubled or even tripled the weight of visual assets.
2016-2019: the SPA era. React, Angular, and Vue.js shifted rendering to the client side. The JavaScript needed to run a page exploded. Bundles of 500 KB+ became commonplace.
2020-2025: accumulated technical debt. Consent banners (GDPR), analytics scripts, chat widgets, A/B testing tools, and third-party tags piled up. Each addition seems harmless, but their accumulation often adds 200 to 500 KB per page.
Anatomy of a web page in 2025
Breakdown by resource type
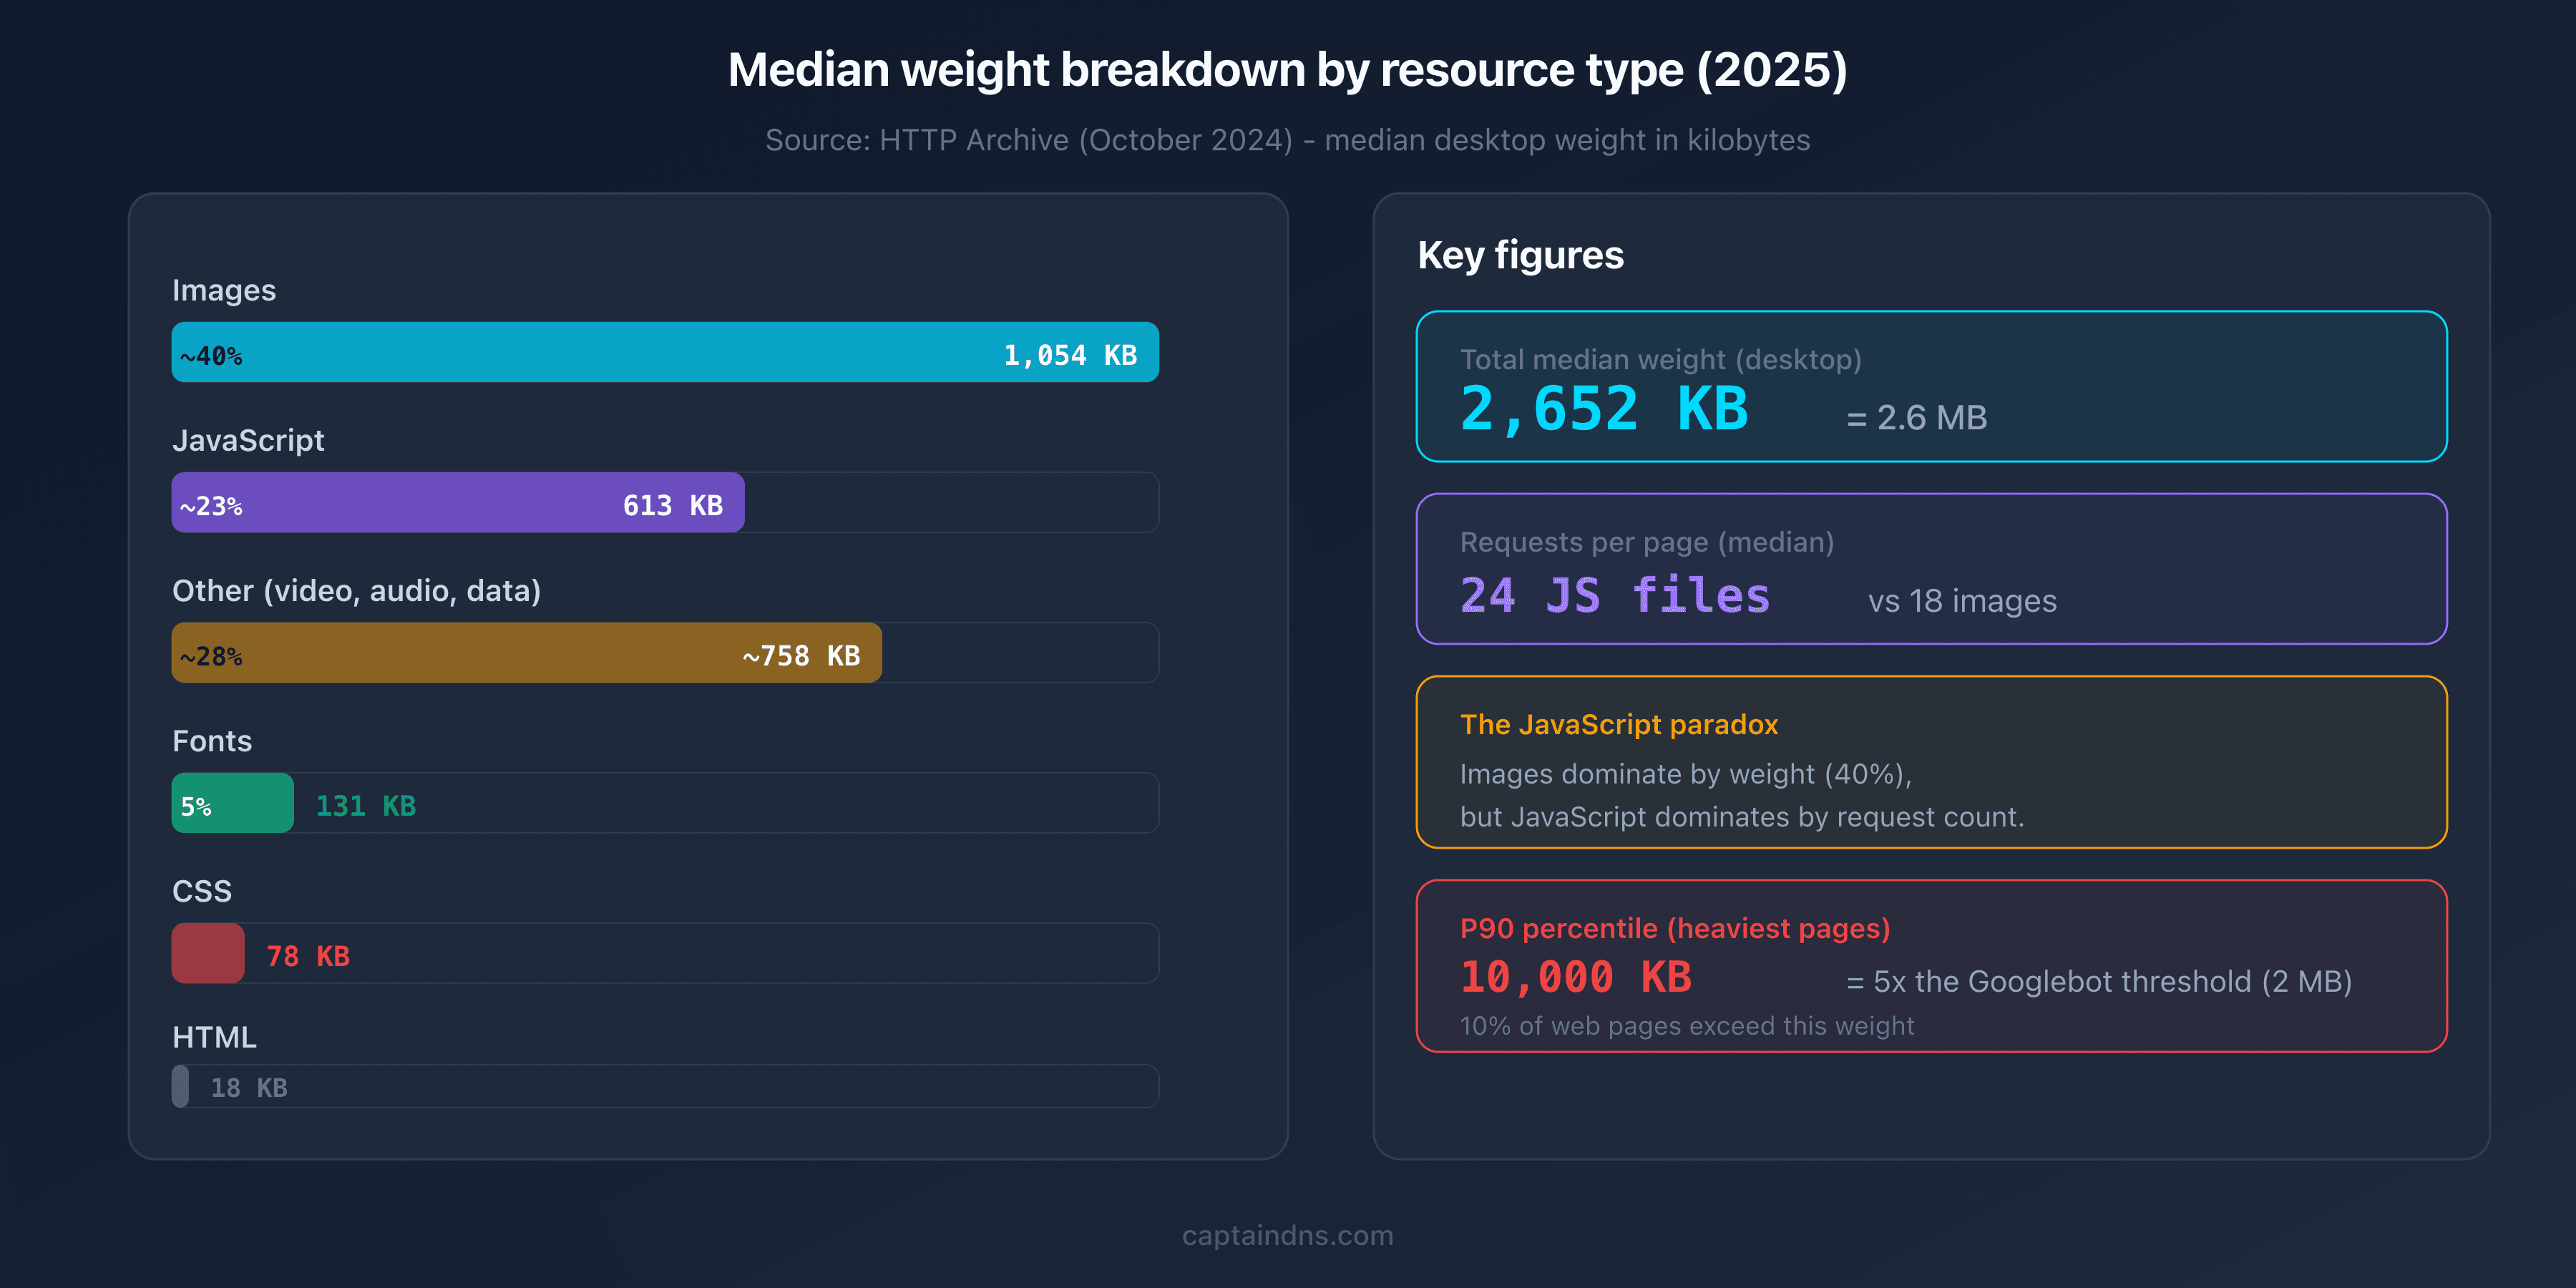
According to HTTP Archive (October 2024), here is the median weight breakdown by resource type on desktop:
| Resource type | Median weight (desktop) | Median weight (mobile) | Share of total |
|---|---|---|---|
| Images | 1 054 KB | 900 KB | ~40% |
| JavaScript | 613 KB | 558 KB | ~23% |
| Fonts | 131 KB | 111 KB | ~5% |
| CSS | 78 KB | 73 KB | ~3% |
| HTML | 18 KB | 18 KB | ~1% |
| Other (video, audio, data) | ~758 KB | ~651 KB | ~28% |
The JavaScript paradox: fewer images, more scripts
A reversal happened in 2024: JavaScript surpassed images in number of requests. The median desktop page now loads 24 JavaScript files vs. 18 images. In raw weight, images still dominate (1 054 KB vs. 613 KB), but the trend is clear: JavaScript is becoming the top resource by file count.
This paradox has concrete consequences. A 50 KB image file is downloaded and displayed. A 50 KB JavaScript file is downloaded, parsed, compiled, and executed. The impact on CPU and Largest Contentful Paint (LCP) is disproportionate relative to raw weight.
Percentiles: the long tail of bloated pages
The median only tells part of the story. The upper percentiles reveal the scope of the problem:
| Percentile | Desktop | Mobile |
|---|---|---|
| P50 (median) | 2 652 KB | 2 311 KB |
| P75 | ~5 200 KB | ~4 500 KB |
| P90 | ~10 000 KB | ~8 500 KB |
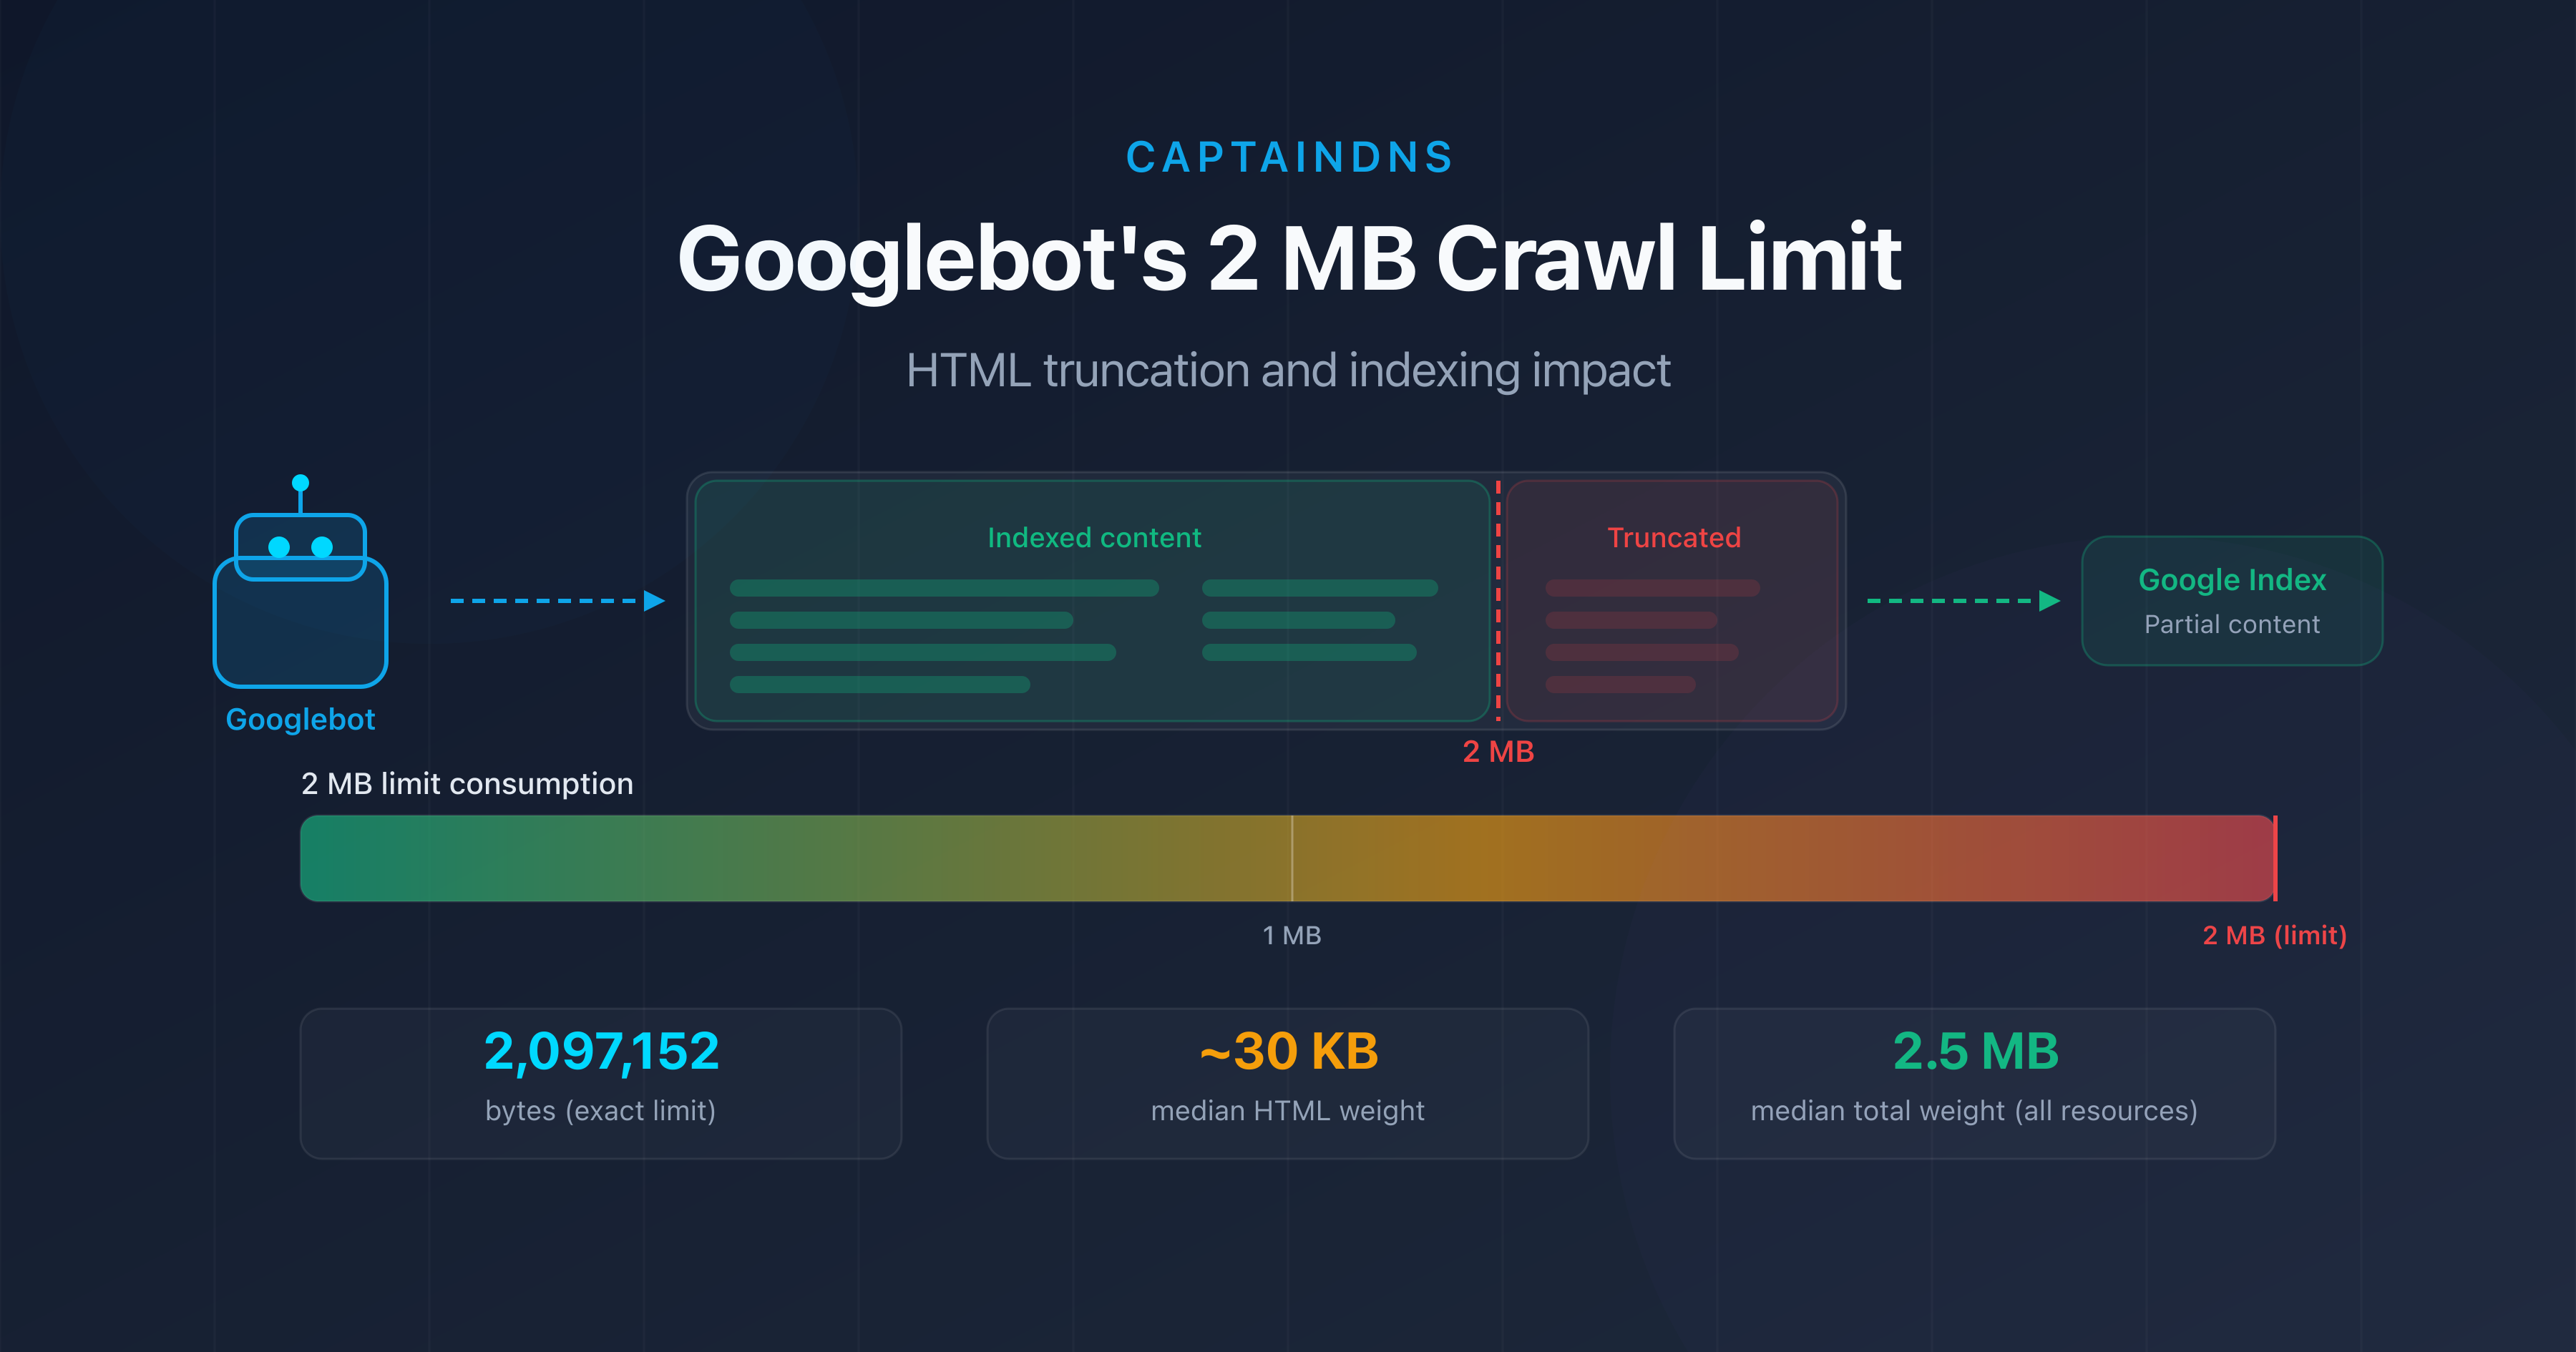
At the P90, a desktop page weighs 10 MB. That's 5x Googlebot's truncation threshold (2 MB of HTML). These extreme pages aren't rare: 10% of the web falls into this category.
Why are web pages getting heavier?
The JavaScript framework explosion
In 2015, the median JavaScript per page weighed ~300 KB. By 2024, it reached 613 KB - double in 9 years. Modern frameworks (React, Next.js, Nuxt, Svelte) are more efficient than their predecessors, but they carry an irreducible runtime. A "Hello World" in React already weighs ~40 KB minified and gzipped.
Tree shaking and code splitting help, but they don't offset the proliferation of dependencies. A typical e-commerce site loads 30+ npm modules on the client side.
HD images and underused modern formats
Images remain the heaviest resource (1 054 KB median). Yet modern formats (WebP, AVIF) can reduce size by 25 to 50% compared to JPEG. Adoption is growing but still incomplete: in 2024, roughly 30% of images served use WebP, and fewer than 5% use AVIF.
Retina images (2x) and full-width hero images are the main culprits. A 1920x1080 JPEG hero image easily weighs 200-400 KB. The same image in AVIF drops to 80-150 KB.
Web fonts, third-party scripts, and consent banners
Web fonts account for 131 KB per page (desktop median). A site using 3-4 variants of a Google Fonts typeface easily exceeds 200 KB. The WOFF2 format reduced file size by ~30% compared to WOFF, but the number of fonts loaded has increased.
Third-party scripts are more insidious. A typical audit reveals:
- Google Analytics/Tag Manager: 50-80 KB
- Cookie consent banner: 50-150 KB
- Chat widget: 100-300 KB
- Advertising and retargeting pixels: 100-200 KB
- A/B testing: 50-100 KB
The total often exceeds 400 KB of third-party scripts - resources you don't directly control.
Content itself: longer, richer, more interactive
Editorial content is getting longer. An "SEO-optimized" blog post now runs 2,000 to 4,000 words (vs. 500-1,000 in 2010). E-commerce product pages include carousels, reviews, recommendations, and videos. Each element adds HTML, CSS, and JavaScript.
The impact of page weight on performance and SEO
Core Web Vitals and page weight
Google uses three primary metrics to evaluate user experience:
| Metric | What it measures | Relationship to weight |
|---|---|---|
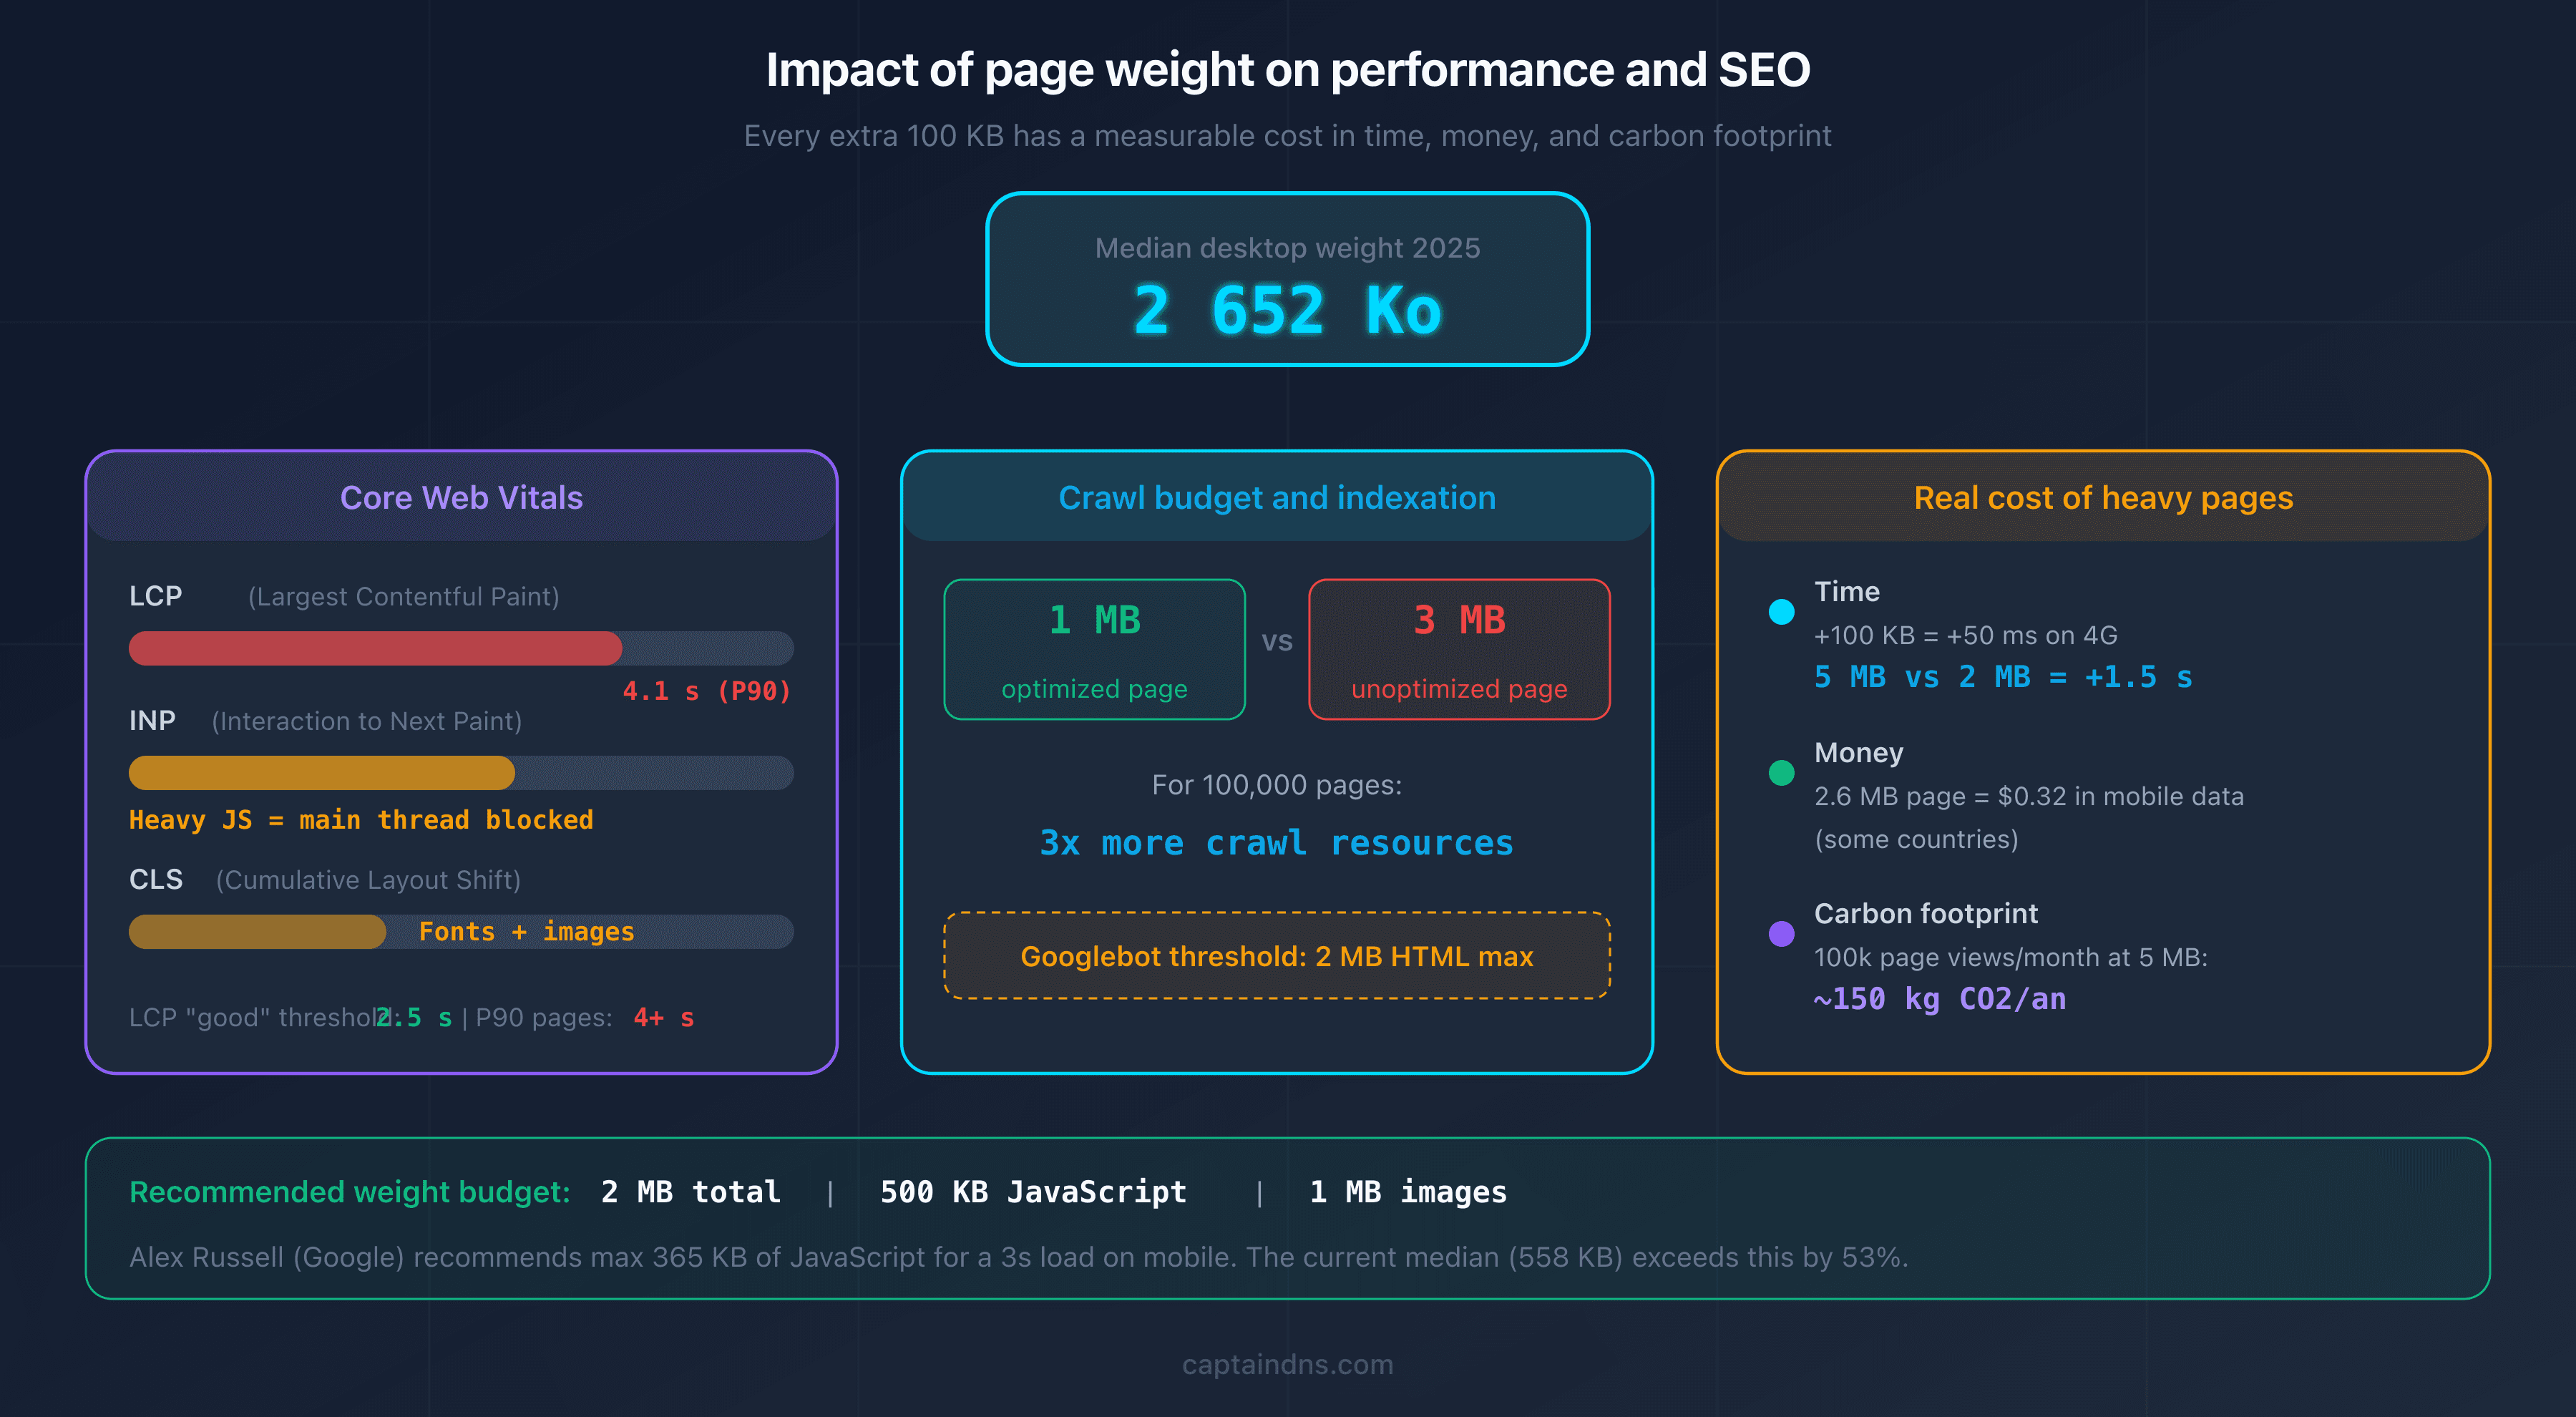
| LCP (Largest Contentful Paint) | Display speed of the largest visible element | The heavier the page, the slower the LCP |
| INP (Interaction to Next Paint) | Responsiveness to interactions | Heavy JavaScript blocks the main thread |
| CLS (Cumulative Layout Shift) | Visual stability | Fonts and images without dimensions cause layout shifts |
A direct correlation exists between total weight and LCP. Pages at the P90 (10+ MB) have a median LCP above 4 seconds, well beyond Google's "good" threshold of 2.5 seconds.
The real cost of heavy pages
Page weight has a measurable cost:
Time. Every additional 100 KB adds ~50 ms of load time on a 4G connection. For a 5 MB page vs. a 2 MB page, the gap reaches 1.5 seconds.
Money. According to whatdoesmysitecost.com, loading a 2.6 MB page costs about $0.32 USD in mobile data in some countries. At scale, for a site with 100,000 visitors per month, server bandwidth costs increase proportionally.
Carbon footprint. Transferring 1 GB of data emits roughly 0.3 g of CO2 (WebsiteCarbon estimate). A site with 100,000 page views per month and 5 MB pages generates ~150 kg of CO2 per year from data transfer alone.
Googlebot's 2 MB threshold
An often-overlooked factor: Googlebot truncates HTML beyond 2 MB. This threshold applies only to the source HTML (not external images or JavaScript). But pages that embed inline CSS or JavaScript can reach this limit. For a complete guide on this topic, see our article on Googlebot's 2 MB crawl limit.
How to measure and reduce your page weight
Measure with Page Crawl Checker
Before optimizing, measure. Our Page Crawl Checker lets you test the weight of any page by simulating Googlebot or a standard browser. You get the total weight, breakdown by resource type, and a check against the 2 MB threshold.
5 high-priority optimization techniques
1. Convert images to WebP or AVIF. The gains are immediate: 25-50% weight reduction with no perceptible loss in quality. Use the <picture> tag to serve AVIF to compatible browsers, WebP as a fallback, and JPEG as a last resort.
2. Audit and remove unnecessary third-party scripts. Each third-party script adds 50-300 KB. Remove the ones that don't deliver measurable value. Load the rest with async or defer.
3. Enable compression (Brotli > gzip). Brotli reduces transfer size by 15-25% more than gzip. Most modern CDNs and servers support it. Verify that your server sends Content-Encoding: br.
4. Implement lazy loading. Images and iframes outside the initial viewport shouldn't load immediately. The native loading="lazy" attribute is sufficient in most cases.
5. Subset your web fonts. If you only use a font for Latin text, serve a subset limited to the characters you need. Going from full latin-ext to a targeted subset can reduce a font from 100 KB to 20 KB.
Weight budget: a technical discipline
Setting a weight budget per page is a best practice. For example: 500 KB max JavaScript, 1 MB max images, 2 MB max total weight. This budget integrates into your CI/CD pipeline: exceeding it triggers an alert before deployment.
Alex Russell (Chrome engineer at Google) recommends a JavaScript budget of 365 KB to guarantee a 3-second load time on an average mobile device. The current median (558 KB on mobile) exceeds this budget by 53%.
Trends for 2026-2028: will the web keep growing?
Factors driving heavier pages
Several trends push page weight upward:
Generative AI. AI-generated content tends to be longer and more detailed. Embedded chatbots add their own scripts (often 200-500 KB). Client-side personalization features require additional JavaScript.
Embedded video. Video previews, animated GIFs replaced by <video>, and video backgrounds are increasingly common. Even a poster image + a player adds 200+ KB.
Interface complexity. Micro-interactions, advanced CSS animations, and interactive components (configurators, comparison tools) add layers of code. Every "nice-to-have feature" has a cost in kilobytes.
Factors driving lighter pages
Counter-trends exist:
AVIF adoption. This image format offers 30-50% better compression than WebP. Its adoption is growing rapidly (Chrome, Firefox, and Safari now support it). By 2028, AVIF could reduce image weight by 30% across the web.
HTTP/3 and QUIC. The new protocol improves connection times and multiplexing. It doesn't reduce weight, but it improves perceived performance, reducing the pressure to optimize page size.
Core Web Vitals as selective pressure. By tying performance metrics to rankings, Google creates an economic incentive to optimize. Sites that ignore page weight will be gradually penalized in SERPs.
Edge computing. Server-side rendering at the edge (edge SSR) reduces the JavaScript sent to the client. Frameworks like Astro, Qwik, and React Server Components are moving in this direction.
Projections
Based on the trend of the last 5 years (+7-9% per year), the median weight could reach:
| Year | Desktop (projection) | Mobile (projection) |
|---|---|---|
| 2025 | ~2 850 KB | ~2 500 KB |
| 2026 | ~3 050 KB | ~2 700 KB |
| 2028 | ~3 500 KB | ~3 100 KB |
These projections assume a technological status quo. Widespread AVIF adoption and Server Components could slow growth. Conversely, embedded AI and video could accelerate it.
Recommended action plan
- Measure the weight of your critical pages: use the Page Crawl Checker on your 10 most-visited pages. Compare them against market medians (2.6 MB desktop, 2.3 MB mobile).
- Identify the heaviest resources: unoptimized images, bloated JavaScript bundles, unused third-party scripts. Rank them by impact and ease of fix.
- Apply the optimizations and set a weight budget: convert to WebP/AVIF, remove unnecessary scripts, enable Brotli. Set a 2 MB per page budget and integrate it into your deployment pipeline.
FAQ
What is the average web page weight in 2025?
According to HTTP Archive (October 2024 data), the median web page weight is 2 652 KB (2.6 MB) on desktop and 2 311 KB (2.3 MB) on mobile. These figures include all resources: HTML, CSS, JavaScript, images, fonts, and other media.
How do you find the weight of a web page?
Several methods are available. Chrome DevTools (Network tab) displays the total weight and weight per resource. CaptainDNS's Page Crawl Checker tests page weight as seen by Googlebot. WebPageTest and Lighthouse provide detailed analyses with optimization recommendations.
Why are web pages getting heavier every year?
Four main factors drive this inflation: JavaScript frameworks that increase client-side code, high-resolution retina images, the proliferation of third-party scripts (analytics, consent banners, widgets), and the content itself, which is getting longer and richer with interactive media.
What is the ideal page weight for SEO?
There is no universal ideal weight, but a budget of 2 MB per page is a good target. For JavaScript alone, Alex Russell recommends a maximum of 365 KB to ensure a 3-second load on mobile. The critical threshold for SEO is the 2 MB HTML limit imposed by Googlebot for indexation.
What is the weight difference between mobile and desktop?
The gap is shrinking. In 2024, the median desktop page weighs 2 652 KB and the median mobile page 2 311 KB, only 13% less. Mobile follows desktop with roughly a 2-year lag. Mobile-specific optimizations (responsive images, lazy loading) no longer offset overall growth.
How do you reduce web page weight?
The 5 most effective optimizations are: converting images to WebP or AVIF (25-50% savings), removing unnecessary third-party scripts (50-300 KB each), enabling Brotli compression, implementing native lazy loading, and subsetting web fonts. Combined, these can reduce weight by 30 to 60%.
Does page weight affect crawl budget?
Yes. The heavier a page, the more bandwidth and download time it consumes during crawling. On a site with 100,000 pages, the difference between 1 MB and 3 MB per page means 3x more resources needed. For large sites, optimizing weight frees up crawl budget for important pages.
What is the impact of site weight on carbon footprint?
Data transfer consumes energy at every step: server, network, and client device. A common estimate is roughly 0.3 g of CO2 per GB transferred. A site with 100,000 page views per month and 5 MB pages generates about 150 kg of CO2 per year from data transfer alone. Reducing your page weight directly lowers this footprint.
Related crawl and indexation guides
- Googlebot's 2 MB limit: what happens when your pages are too heavy
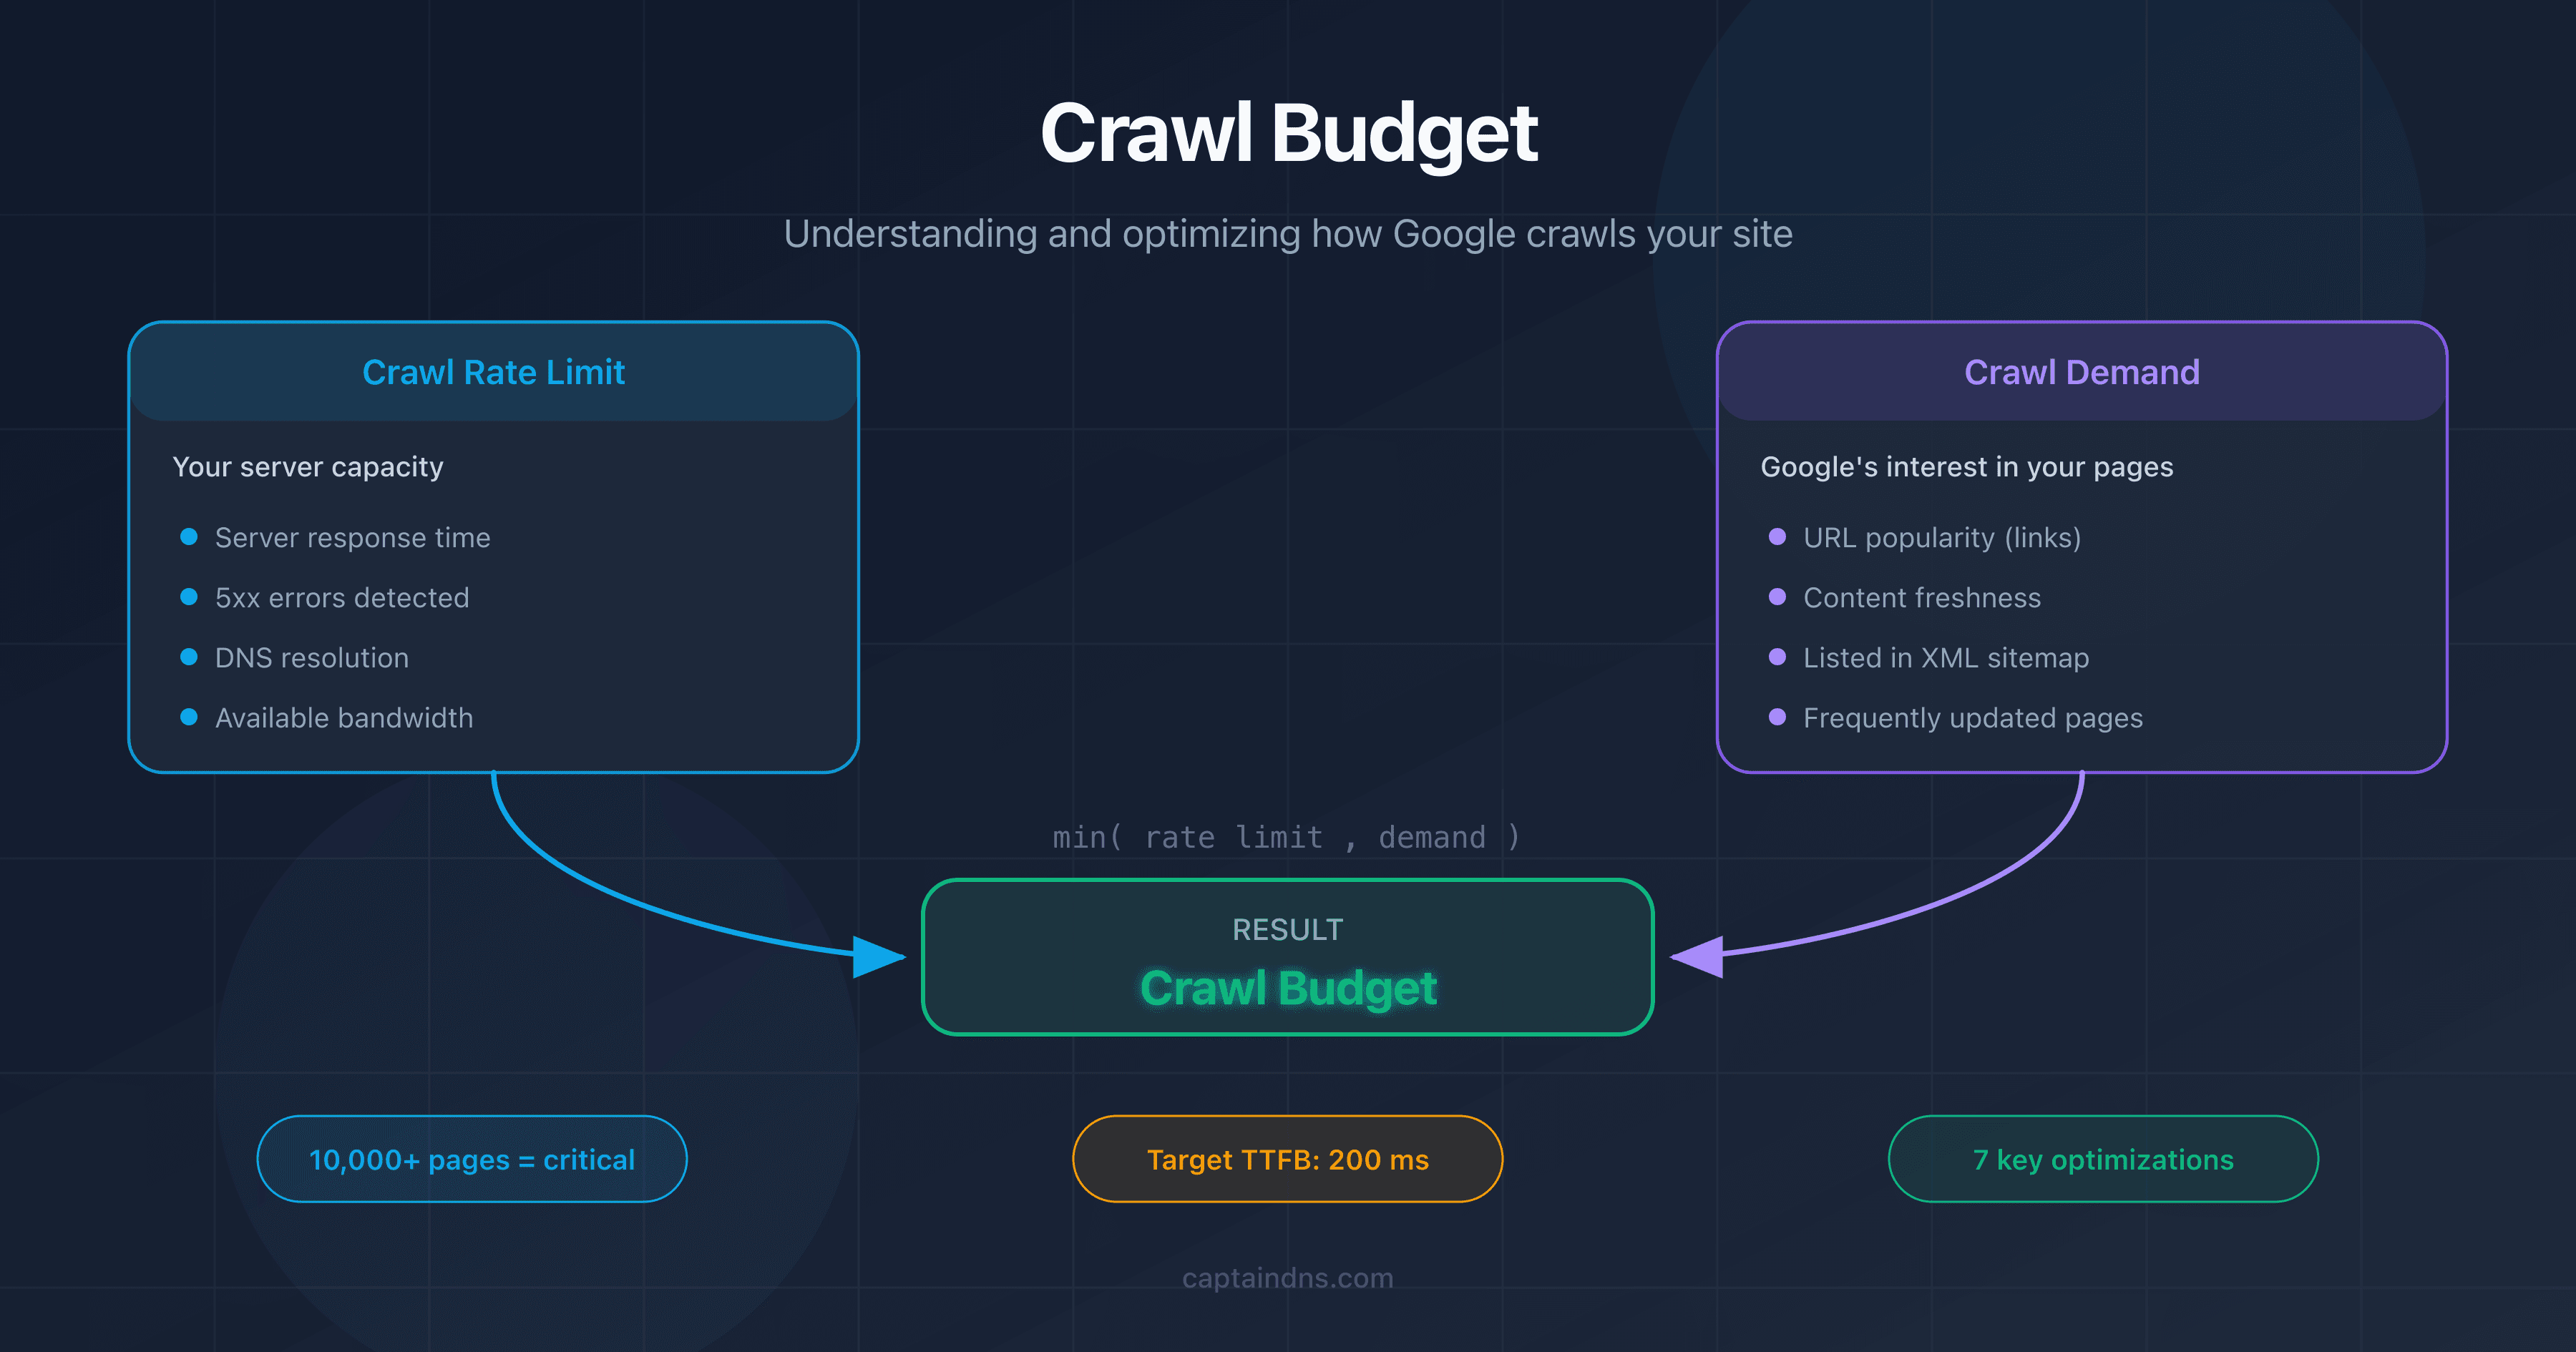
- Crawl budget: understanding and optimizing how Google crawls your site
Sources
- HTTP Archive. Page Weight Report: monthly data on median web page weight.
- HTTP Archive. Web Almanac 2024: annual report on the state of the web.
- web.dev. Fast load times: Google's guide to load time optimization.
- Alex Russell. The Performance Inequality Gap: analysis of JavaScript budgets and web performance.